I have been running a hodgepodge homelab with a mix of enterprise hardware and consumer-grade mini PCs, and it has been challenging to monitor all of my hardware directly within PVE. I am fortunate that my wife lets me run wild in the utility room, but when the OPNsense router goes down, I end up with an upset wife and no internet — which is understandable since she works from home.
My first attempt to monitor server uptime was with Uptime Kuma. I set up pings to my servers and configured notifications to my Home Assistant instance whenever any hardware or monitored service went down. This worked very well. However, being the data nerd that I am, I wanted to record this information and analyze trends over time. I decided to leverage InfluxDB for data storage and Grafana for visualization, mostly because that is what most people on the internet recommended.
Installing InfluxDB
First, I installed InfluxDB v2 as an LXC container on one of my PVE nodes using the Proxmox helper script:
bash -c "$(curl -fsSL https://raw.githubusercontent.com/community-scripts/ProxmoxVE/main/ct/influxdb.sh)"
Although the querying syntax changed significantly (and arguably for the worse) in version 2, I decided to stick with it to ensure easier upgrades in the future.
Manual installation steps, if you prefer:
sudo apt update
sudo apt install influxdb
sudo systemctl enable influxdb
sudo systemctl start influxdb
Once InfluxDB is running, create a database for your PVE metrics:
influx
CREATE DATABASE pve_metrics
exit
InfluxDB is now ready to receive your data.
Configuring PVE to Send Metrics
PVE has native support for writing metrics to InfluxDB. You just need to configure it. First edit the InfluxDB configuration on your PVE server:
nano /etc/pve/status.cfg
dd (or uncomment) and modify the influxdb section:
influxdb:
    server YOUR_INFLUXDB_SERVER_IP
    port 8086
    database pve_metrics
    username YOUR_USERNAME    # optional
    password YOUR_PASSWORD    # optional
Save and exit. Restart the PVE metrics service:
systemctl restart pvestatd
PVE will now start pushing metrics to your InfluxDB instance automatically every minute.
Installing Grafana
Next, install Grafana. Again, I used the Proxmox helper script to spin it up in an LXC:
bash -c "$(curl -fsSL https://raw.githubusercontent.com/community-scripts/ProxmoxVE/main/ct/grafana.sh)"
Once installed, access Grafana at:
http://YOUR_SERVER_IP:3000
To connect InfluxDB as a data source, go to Configuration > Data Sources > Add Data Source. Choose InfluxDB, and set the URL to your InfluxDB server (usually http://localhost:8086). Set the database name to pve_metrics. Add your username and password if authentication was enabled, and then save and test the connection.
Grafana should now be able to query your PVE metrics.
Building Dashboards
You can either build your own dashboards from scratch or import prebuilt templates.
If building from scratch, go to create a new dashboard, add a new panel and choose InfluxDB as the data source.
Example queries:
# CPU usage:
SELECT mean("cpu") FROM "pveperf" WHERE $timeFilter GROUP BY time($__interval) fill(null)
# Memory usage:
SELECT mean("mem") FROM "pveperf" WHERE $timeFilter GROUP BY time($__interval) fill(null)
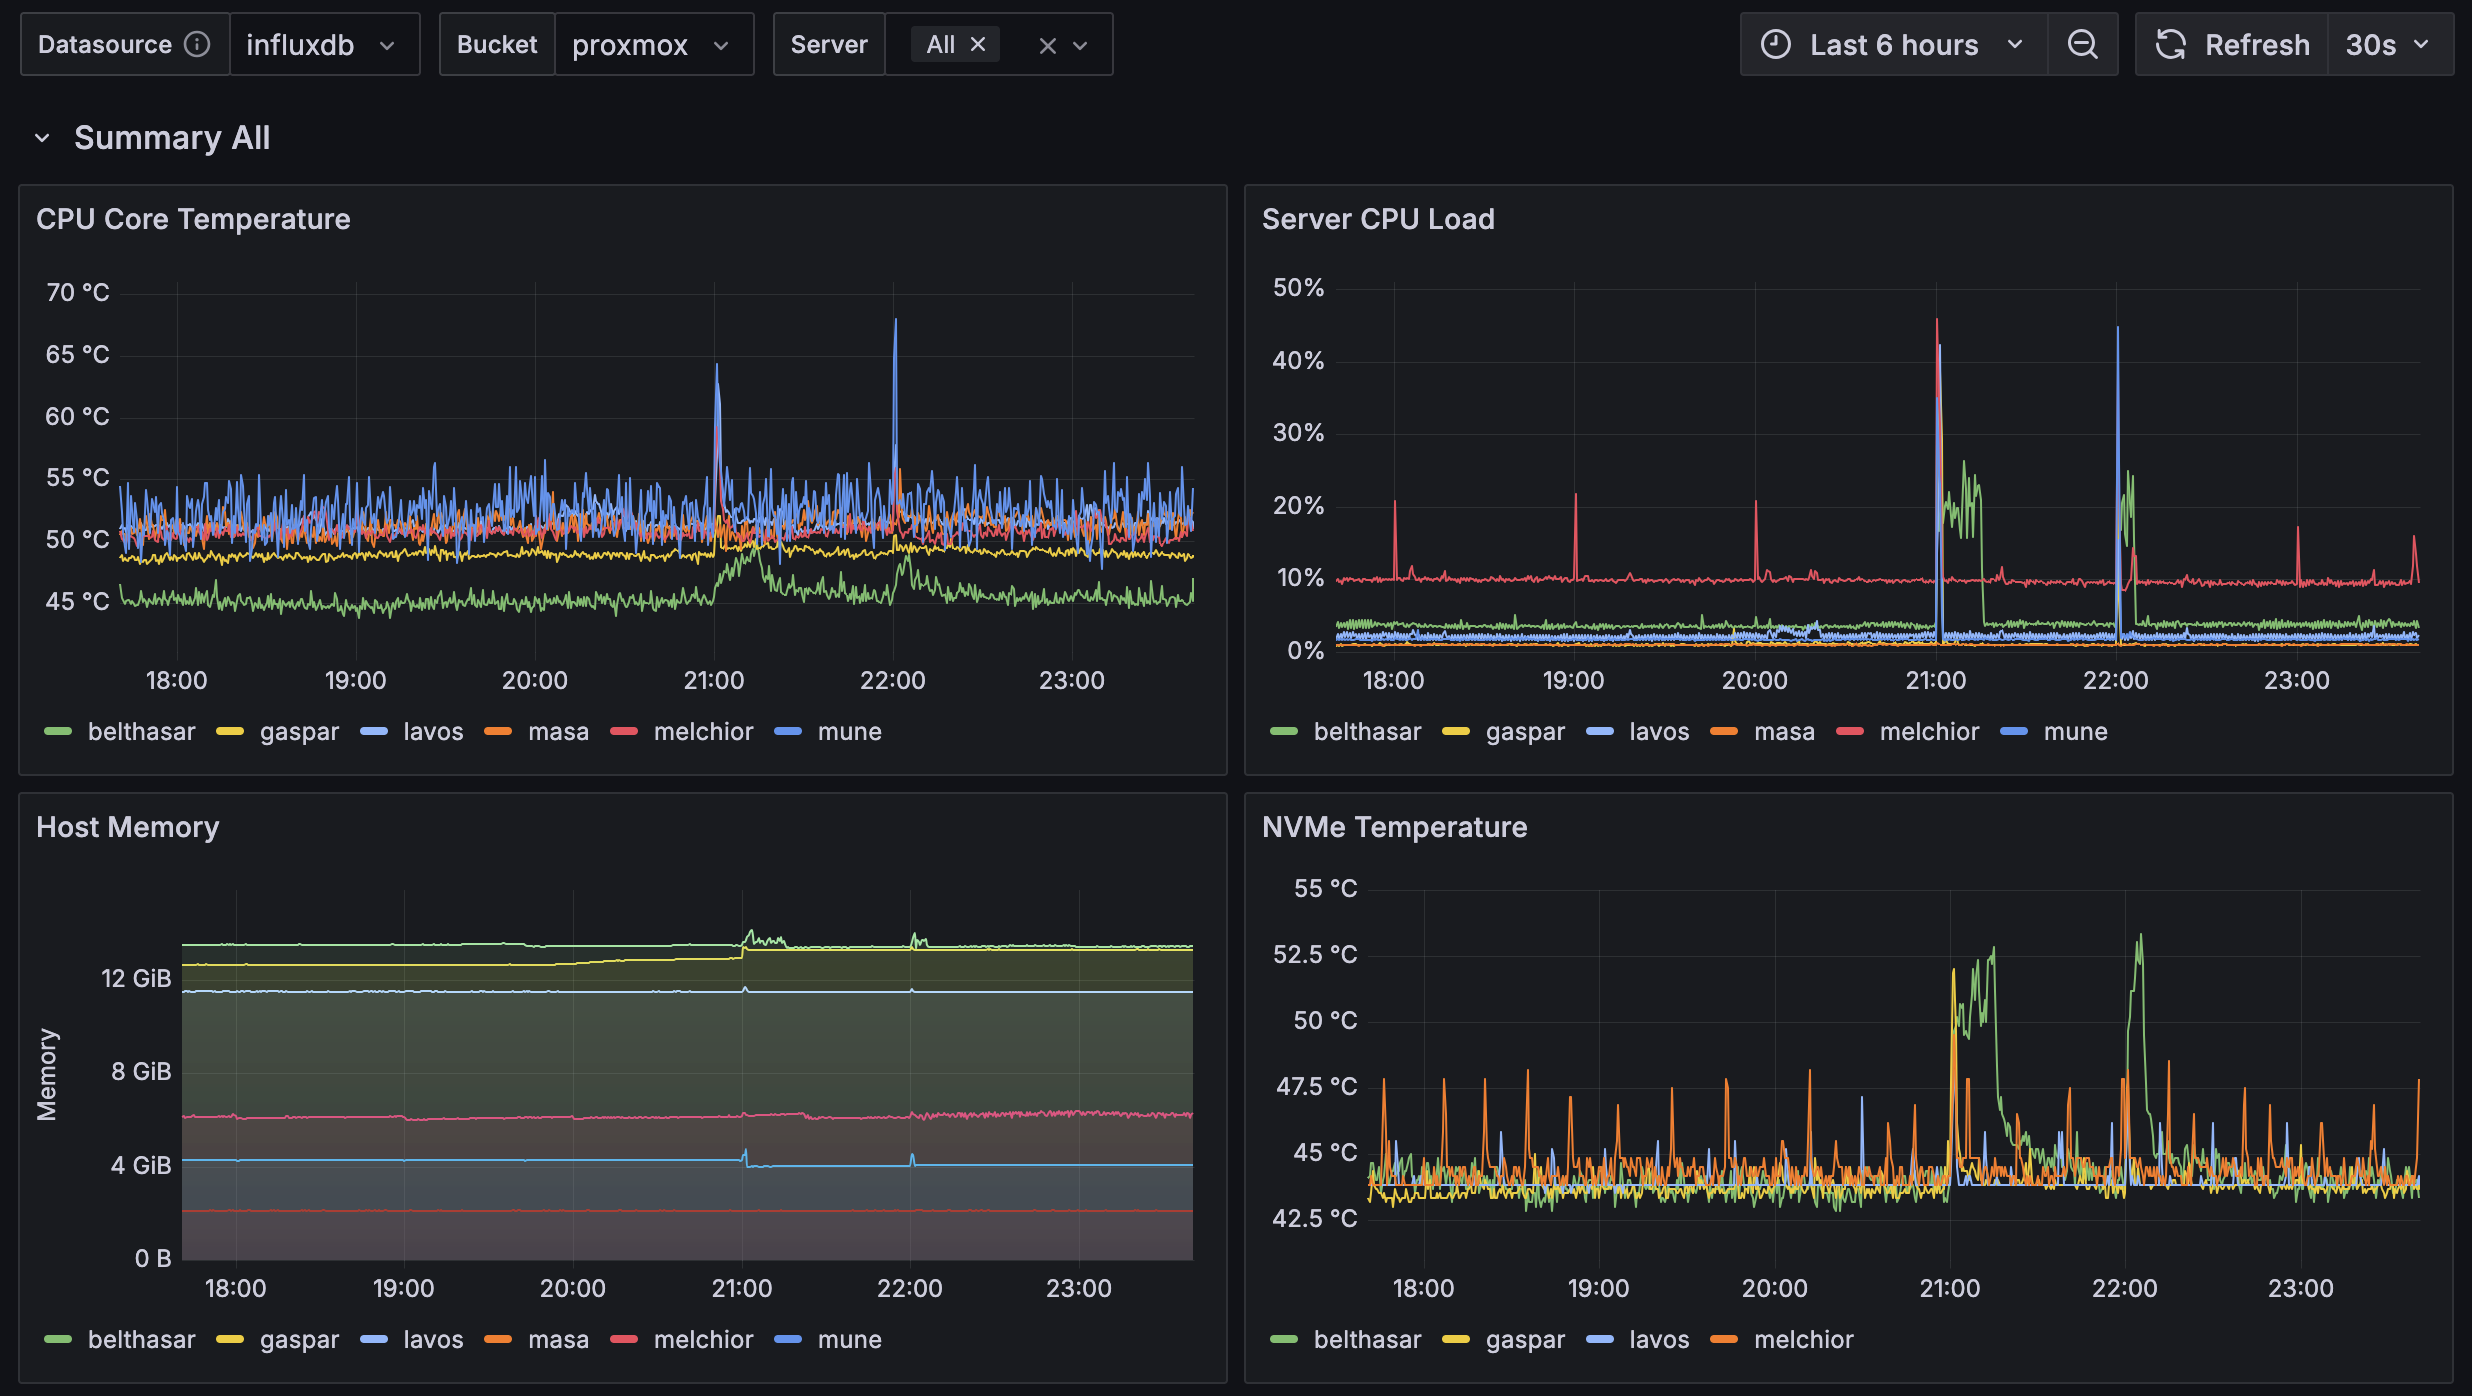
Disk I/O, network throughput, and other metrics are also available depending on how your PVE setup streams data. Here’s an example that I built for monitoring mine:
If importing a prebuilt dashboard, there’s many free PVE Grafana dashboards available online. To import one, go to Dashboards > Import. Then enter a dashboard ID from Grafana.com.
Setting up InfluxDB and Grafana for PVE monitoring might seem like a small project, but the payoff is huge. With just a few hours of work, you get real operational visibility, beautiful dashboards, and a serious upgrade in how you manage your environment. If you are running Proxmox VE at any scale, even just a few nodes, setting this up is absolutely worth it.